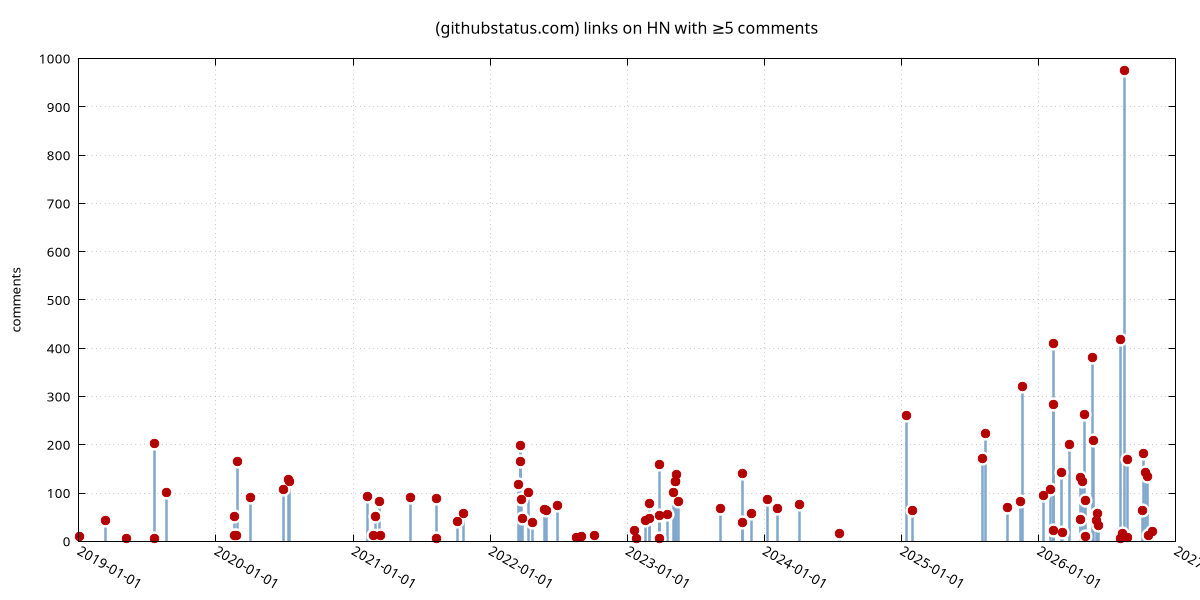
The shape of this HN duplicate detector actually works as a GitHub uptime chart:
https://news.ycombinator.com/from?site=githubstatus.com
It's driven by aggregated user complaints, so it's pretty high-quality. Comment counts are a proxy for "how bad was the outage" + "how long was the outage thread topical for".
edit to add: Here's a scatterplot of the same,
Really smart insight lmao
lol